Simple
 For Jolokia to work, an agent must be deployed, the one way or
the other. But this is a common business:
For Jolokia to work, an agent must be deployed, the one way or
the other. But this is a common business:
-
The WAR Agent gets deployed as any other Jakarta EE web application. Often this is as simple as copy of the agent WAR into a certain directory (like
webapps/for Tomcat). Or it gets deployed via an administrative user interface (web GUI or command line tool). In any case, the procedure should be familar to any Java developer or administrator dealing with Jakarta EE applications. -
The OSGi Agent gets deployed as any other OSGi bundle, which is also a well known procedure (although specific to each OSGi container). For the pure bundle, there is a requirement for an OSGi runtime to include OSGi CMPN Whiteboard Specification for Jakarta™ Servlet implementation.
-
The JVM JDK 11 Agent requires for its setup some extra command line parameter for the JVM, but this shouldn’t be a big deal either.
On the other hand, setting up JSR-160 connectors is not
that easy as it might appear. There are various kind of
issues like problems when using different JDK versions on
client and server side or exposing the
PlatformMBeanServer.
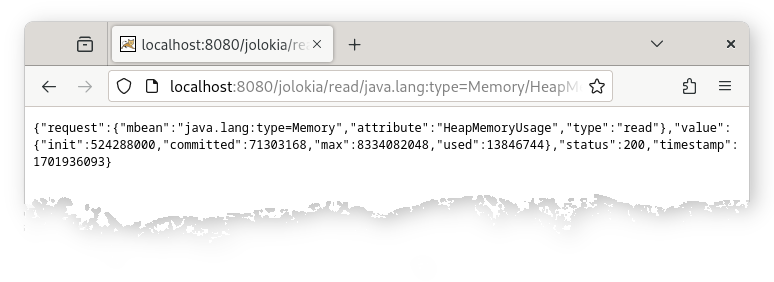
Once the agent has been installed, using Jolokia on the client side is easy. Since the protocol relies on a standard protocol (HTTP) and format (JSON), it is easy for non-Java systems to access MBeans. It can be even accessed from within the browser with a simple URL. Although this is still a bit cryptic, it is a good test to check the installation of Jolokia.
Assuming that the agent is reachable under
http://localhost:8080/jolokia, memory usage can
be checked with the browser using http://localhost:8080/jolokia/read/java.lang:type=Memory/HeapMemoryUsage URL:
The actual value is contained in the returned JSON
representation under the key value. In this
example, a so called path (i.e. used)
is appended to the URL which allows for deep access in more
complex Java types (javax.management.openmbean.CompositeData in this
case).
Try:
Next
-
See why Jolokia plays nicely with your firewall.
-
Jolokia is really fast. See why.
-
Go Back to the Features Overview.